Bitcoin’s ‘Bart Simpson’ Fear Comes Down to One Tripwire: $75,800 and Liquidity
Bitcoin ripped ~25% in August to ~$80.7K, now hovering near $77.5K. A true Bart flash crash needs a swift break of $75,800 and forced liquidations—otherwise expect a slower correction.

Because Bitcoin
September 2, 2026
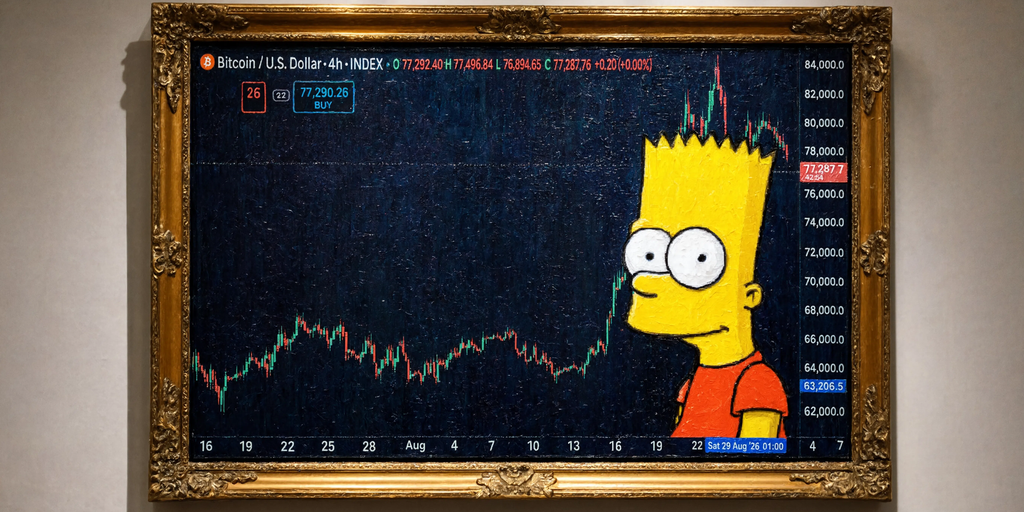
Bitcoin just delivered a vertical August, jumping from roughly $64,420 on August 19 to nearly $80,700 by August 25, then cooling to about $77,470 while it chops sideways near $77,500. That spike–flat–fade has traders tossing around the Bart Simpson meme. The meme is harmless; the mechanics behind it are not. If you care about whether a sharp reversal actually prints, focus less on cartoons and more on one level and the fuel behind it.
The only level that matters for the meme to go live Bart isn’t a technical indicator; it’s shorthand for symmetry. You need a fast giveback that mirrors the rally’s speed. Applied here, that means unwinding the entire August run in hours, not weeks—roughly a 17% air-pocket back toward the $64,000 launch zone. The tripwire many are watching: $75,800. Lose that decisively, and the path opens. Hold above it, and the setup is more likely to fizzle.
The four-hour tape isn’t screaming breakdown - RSI sits near 44.8—not washed out, leaning soft, but far from the sub-30 extremes that tend to accompany true pukes. - ADX is around 22, below the 25 threshold traders often use to confirm a directional trend; that’s stall, not thrust. - The Squeeze Momentum indicator is flashing bearish with falling momentum and a compression zone—translation: energy is building for a bigger move, direction TBD. - Structure still skews positive: the 50-period EMA remains above the 200-period EMA, a classic bullish stack even as momentum cools.
Individually, none of these print “imminent crash.” Collectively, they describe a market pausing, not buckling—hence why debate over a real Bart is unresolved.
What would actually cause a flash crash here A cartoon pattern doesn’t push price—liquidity does. A real Bart requires a catalyst violent enough to trigger cascading leveraged liquidations, not a routine pullback. We’ve seen this movie: in October 2025, a tariff headline tied to Trump sparked roughly $19 billion in liquidations. The mechanism exists; it just hasn’t shown itself on the current four-hour read.
For this setup, think sequence: 1) A decisive break of $75,800 2) Perp open interest and leverage stacked the wrong way 3) Stops and margin calls chasing bids lower Hit those in order and the symmetry can materialize quickly. Fail step one, and it’s mostly message-board noise.
Why September is amplifying the anxiety Seasonality isn’t destiny, but it tilts the table. Since 2013, Bitcoin has finished eight of the last 13 Septembers lower, with an average decline of about 2.97%—the weakest month on the calendar by both average and median. Layer in a live macro roll of the dice: the CME FedWatch tool is pricing around a 64% chance of a Fed hike on September 15–16. Tighter policy often pressures high-beta assets as financing costs rise and investors rotate toward bonds and gold.
Flows reflect that caution. Spot Bitcoin ETFs saw roughly $236 million in outflows on Tuesday. Meanwhile, oil has pushed into the low $90s a barrel after fresh U.S.–Iran strikes near the Strait of Hormuz, adding inflation risk that could harden the case for a hike. None of these guarantee a crash; they do, however, nudge positioning toward risk-off at the margin. That’s a different engine than a liquidation cascade, even if both point the same way.
The realistic alternative: same distance, different path There’s a bearish path that doesn’t look like Bart at all. Draw a descending trendline from the approximately $80,626 August high using nearby supports and you get a gradual channel that bleeds toward $62,000 over about eight weeks—late October timing—rather than in a single candle. The percentage drawdown rhymes with the flash-crash scenario, just distributed across a seasonally soft September and a historically jumpy October.
We’ve seen that structure, too. Earlier this year, BTC carved a compressive wedge—lower highs against descending resistance—that preceded the October 2025 and January 2026 breaks. Those were grinding, structural drawdowns, not one-and-done wicks.
My playbook If you’re trading the meme, reduce it to triggers and fuel. Watch $75,800 on spot and perps, monitor open interest, funding, and options gamma around key strikes. If compression resolves lower while leverage builds and ETF outflows persist, the odds of a liquidation-led snapback rise. Absent that alignment, a channeling correction toward $62,000 over weeks is the higher-probability bear path. Two routes, one destination; the tempo is the trade.